Project note
I led the full product redesign covered by DFINITY's Medium article, Internet Computer Dashboard: Making ICP Data More Accessible, published on April 25, 2025.
This page preserves the public launch context and screenshots. The original article remains the canonical source for the announcement.
What the redesign covered
The Internet Computer Dashboard had existed as a place to inspect live network data, historical metrics, subnet information, and activity across the Internet Computer. The redesign moved it from a collection of separate data pages towards a more structured way to understand the network and the ecosystem around it.
The main product shift was information architecture. I led the work to reorganise the dashboard so different kinds of data were easier to find and connect. Infrastructure, subnets, tokens, projects, and ecosystem activity no longer had to sit in isolated views.
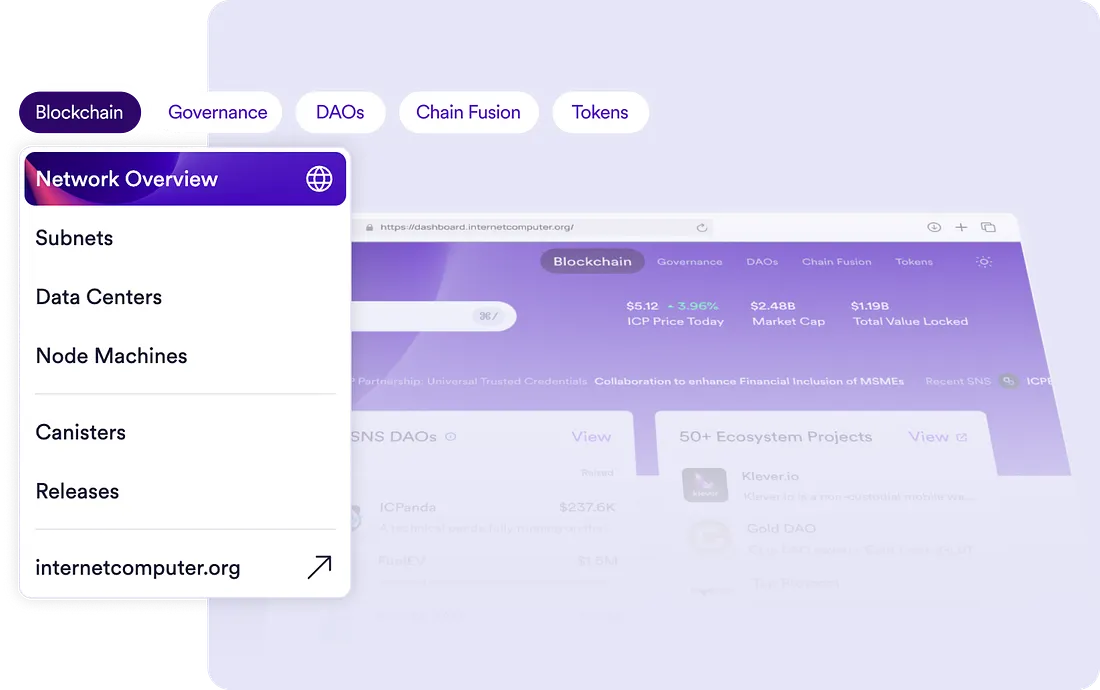
Navigation and homepage
The updated navigation was designed around the most important user paths. A developer, researcher, token holder, or ecosystem participant should be able to move from a broad overview into specific details without needing to already know where every metric lives.
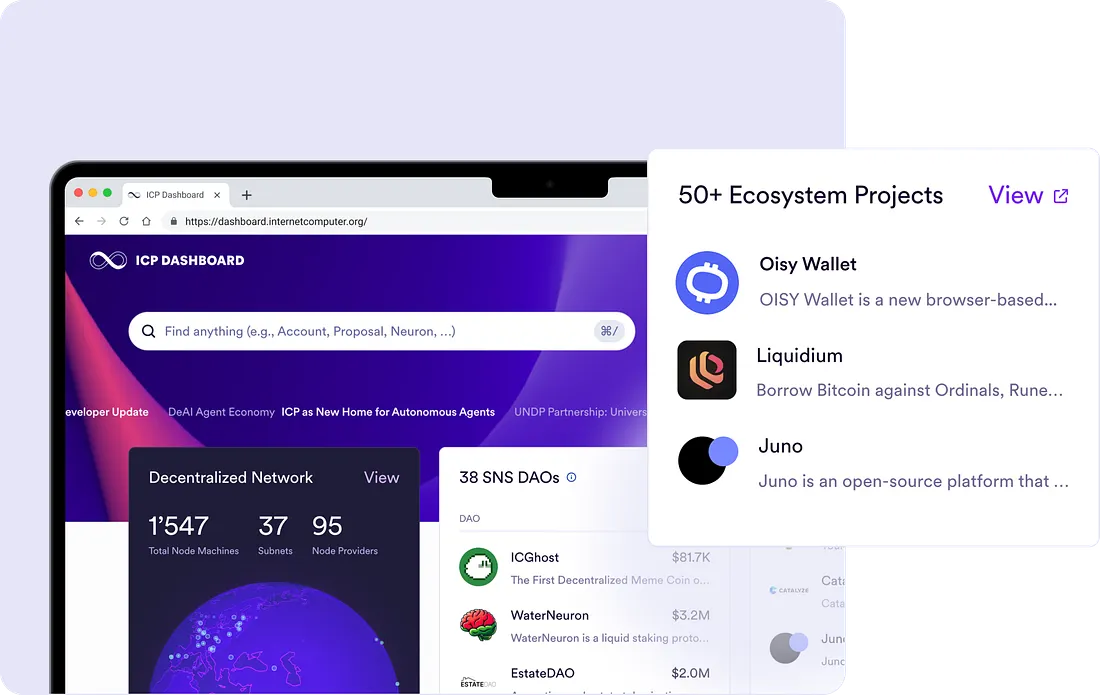
The homepage became a broader entry point to the Internet Computer ecosystem. Network statistics, projects, tokens, and events gave users context about the protocol and the activity built on top of it.
Network and subnet views
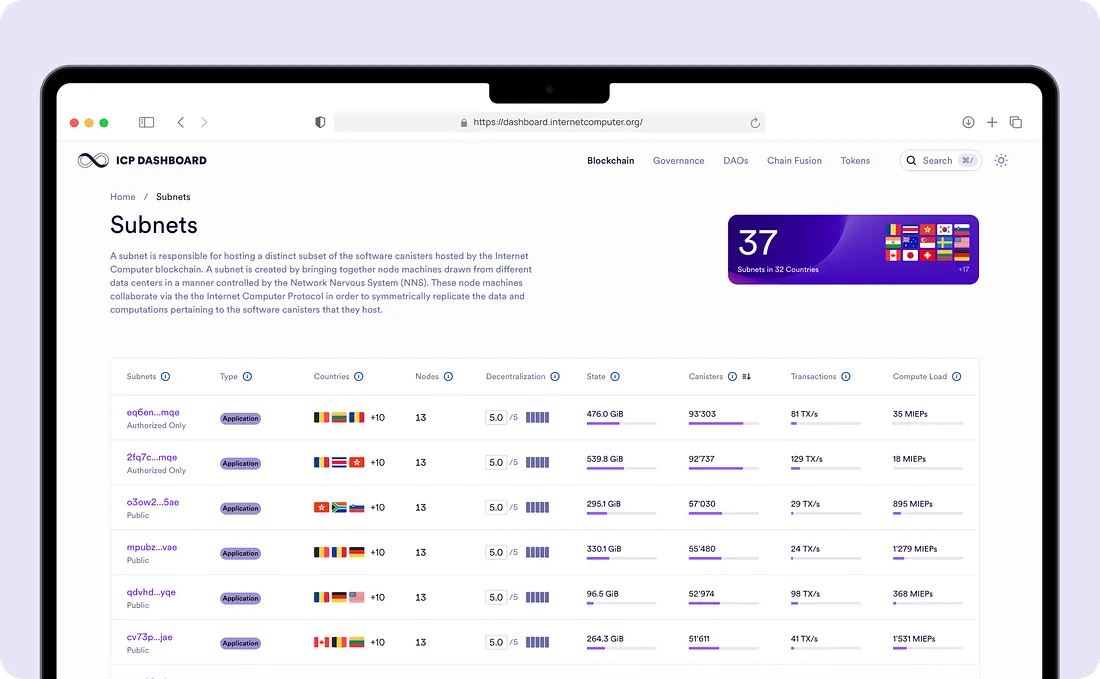
The network section was updated to make infrastructure easier to explore. It gives users a way to move through subnets and understand how the network is distributed across node machines, node providers, data centers, and geographies.
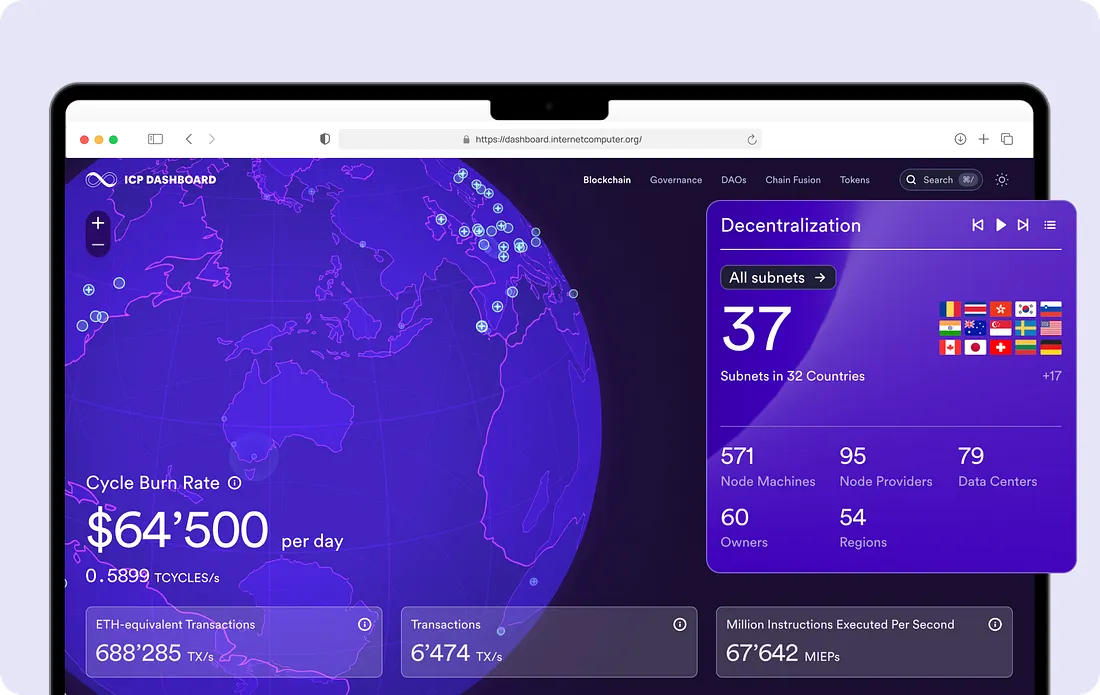
The subnet experience is especially important. The article highlights clearer subnet layouts with signals such as canister counts, transaction rates, load, geography, and decentralization indicators. The intent is to make subnet comparison faster: users can see where workload is concentrated, how balanced a subnet is, and what kinds of applications are running there.
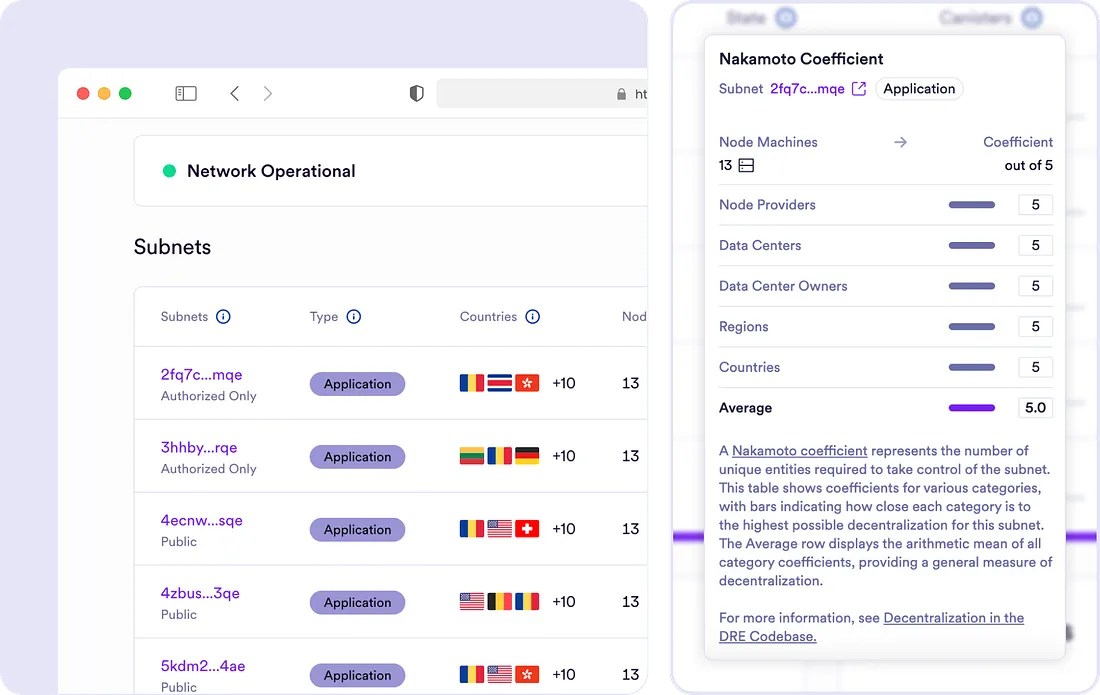
For a technical network like the Internet Computer, this matters because raw infrastructure data can be hard to interpret without context. A dashboard that shows distribution, load, and decentralization in one place makes it easier to reason about network health and usage.
Ecosystem tokens
Another major part of the update is the token section. The article describes early support for chain-key tokens such as ckBTC and SNS tokens, with a direction toward broader ecosystem token coverage.
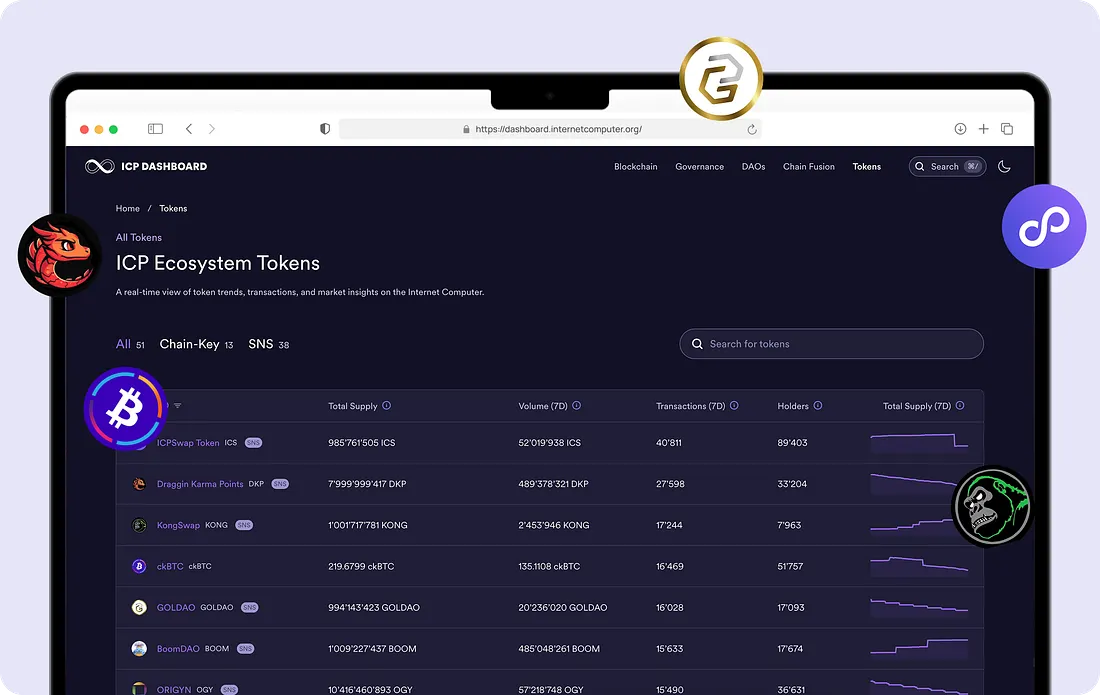
The planned expansion includes more token-level context: prices, volume, transaction activity, history, and deeper asset pages. Together, these would extend the dashboard from network monitoring into ecosystem data.
Why DFINITY framed this as necessary
The core problem described in the article is fragmentation. The dashboard already had a lot of useful information, but users often had to jump between pages to understand what was happening. The update tries to make practical questions easier to answer:
- What is happening on the Internet Computer right now?
- Which projects or assets are showing momentum?
- How are principals, canisters, tokens, SNS projects, and DAOs connected?
- What does a specific canister do, and how can someone inspect it further?
- How does a new token or DAO fit into the wider ecosystem?
Those questions are product-design questions as much as data questions. The structure around the metrics determines how quickly each audience can form a mental model of the network.
What was planned next
The article points to several follow-up directions:
- Expanded support for ICRC-based and ecosystem tokens.
- Price data aggregated from multiple sources.
- Search across tokens, principals, canisters, and SNS projects.
- More contextual pages that combine relevant data for a node, project, principal, or asset.
Together, these changes would make the dashboard feel more like a connected knowledge and analytics layer for the Internet Computer.
My takeaway
The interesting part of this update is the move from data availability to data comprehension. Publishing metrics is useful, but the harder product challenge is helping people understand what those metrics mean, how entities relate to one another, and where to look next.
For ICP, that distinction matters. The network has protocol-level infrastructure, onchain applications, token standards, SNS DAOs, chain-key assets, principals, canisters, and ecosystem projects. A dashboard that can connect those layers clearly becomes part of how people understand the platform itself.